
Bergman took BBC customer feedback and made it useful for the contact centre team to 'see'. It is intended to tell human stories of the data: "what are people contacting us about?"; "how many people are contacting us now compared to the same day last week?"; "what are they actually saying?"; "what is the most significant issue people are contacting us about?". It's not comprehensive. It aims to provide a window on now, to help flag up issues that need attention (and conversely, just to reassure that everything is normal). Previously the information was hidden in spreadsheets and powerpoint documents requiring conversations, people and time.
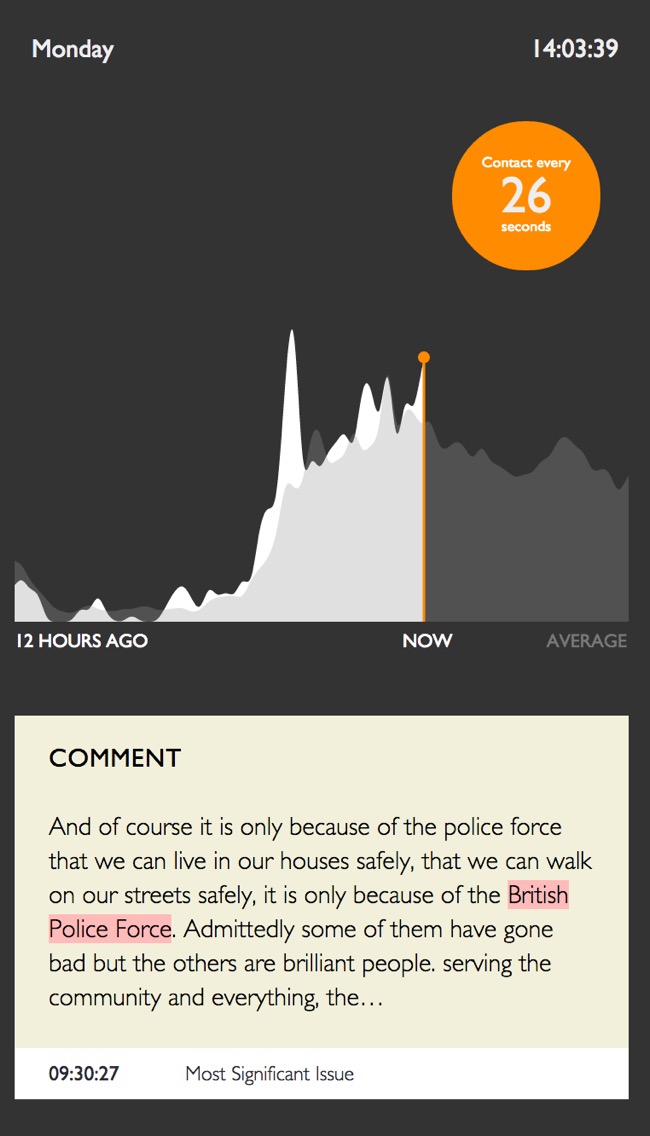
We were influenced by John Thakara's idea of a macroscope: something that helps us to see what the aggregation of many small things looks like, so we can understand it and act on it. It's a powerful concept yet, certainly in the way we used it, it's also quite simple. We added and subtracted. We looked to state what was significant by looking at the volume compared to an average on a 24 hour timeline and we created cards or tickets which annotated this volume data with "most significant contact category", "most recent contact category created". Verbatim comment cards are brought in to gravitate the viewer to the human voice of the audience; a microscope within the macroscope.
Outwardly there are also some unusual elements to the work. Significant spikes in volume occur rarely and rather than design the scale to the maximum volumes, we decided to keep a static scale of 'normal' volume and have the spikes 'break' the screen. This not only helps to maintain a helpful view for 99% of the time, but also serves to make the moments when the spikes occur more visually arresting: the spike literally extends off the top of the screen. The orb with the volume of audience contacts right now also pulses as a heartbeat of their customer base.
Project information
- Launched
- 2013
- Client
- BBC
- Team
- Andrew Pendrick, Frankie Roberto, James Boardwell